I have a very general question: how to manage the layout for the division/graphs in a dashboard made by dash-plotly in python. Assume I have a code below:
def charts():
    data = [go.Bar(
        x=['giraffes', 'orangutans', 'monkeys'],
        y=[20, 14, 23] )]
    return data
app = dash.Dash()

app.layout = html.Div([

    html.Div([
        dcc.Graph(
            id='figure1',
            figure=charts()
        ),
    ], style={'width': '49%', 'display': 'inline-block'}),
    html.Div([
        dcc.Graph(
            id = 'figure2',
            figure=charts()
        ),
        dcc.Graph(
            id='figure3',
            figure=charts()
        )
    ], style= {'width': '49%', 'display': 'inline-block'})
])

if __name == '__main__':
    app.run_server()
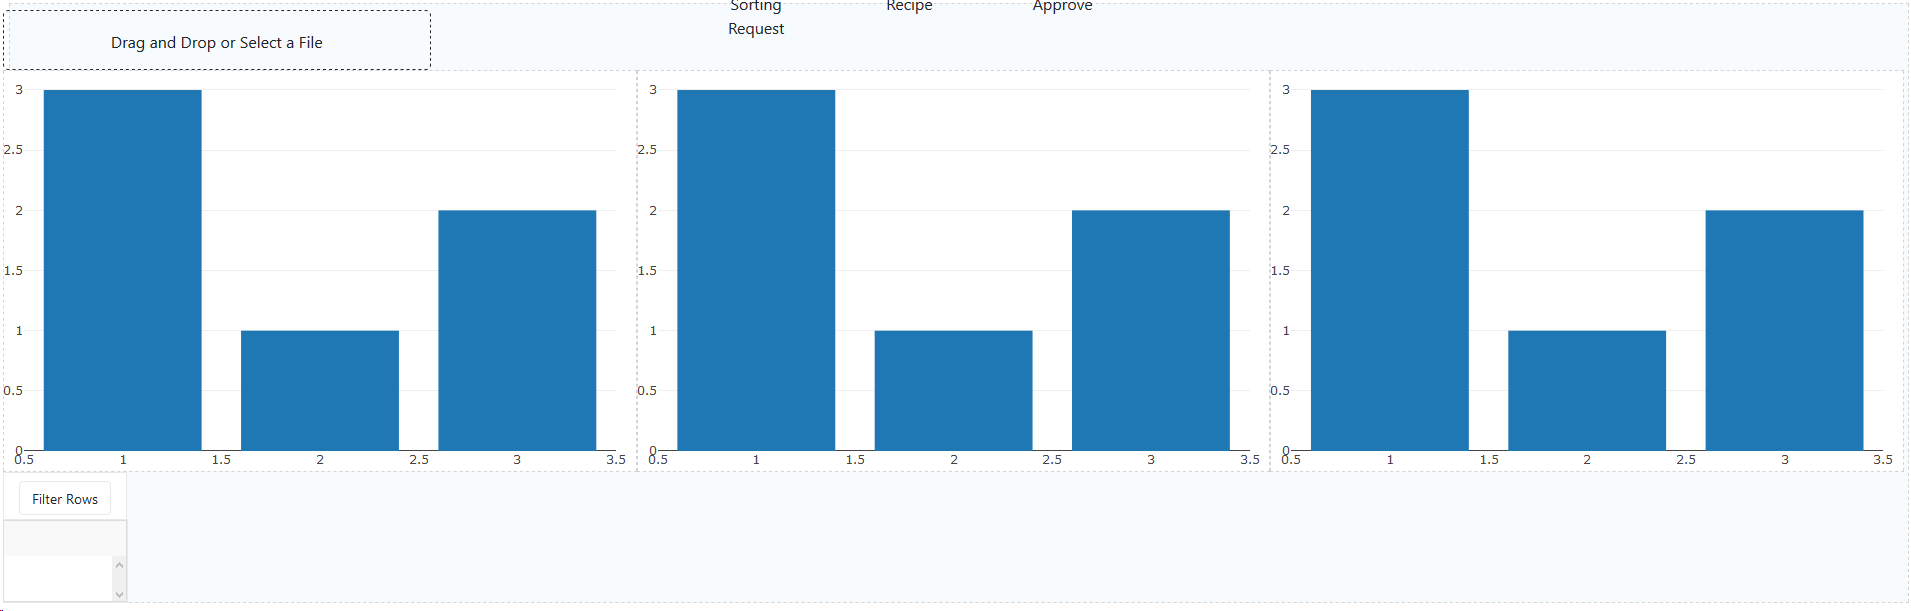
What I want is:
+++++++++++++++++++++++
+         +  figure2  +
+ figure1 +           +
+         +  figure3  +
+++++++++++++++++++++++
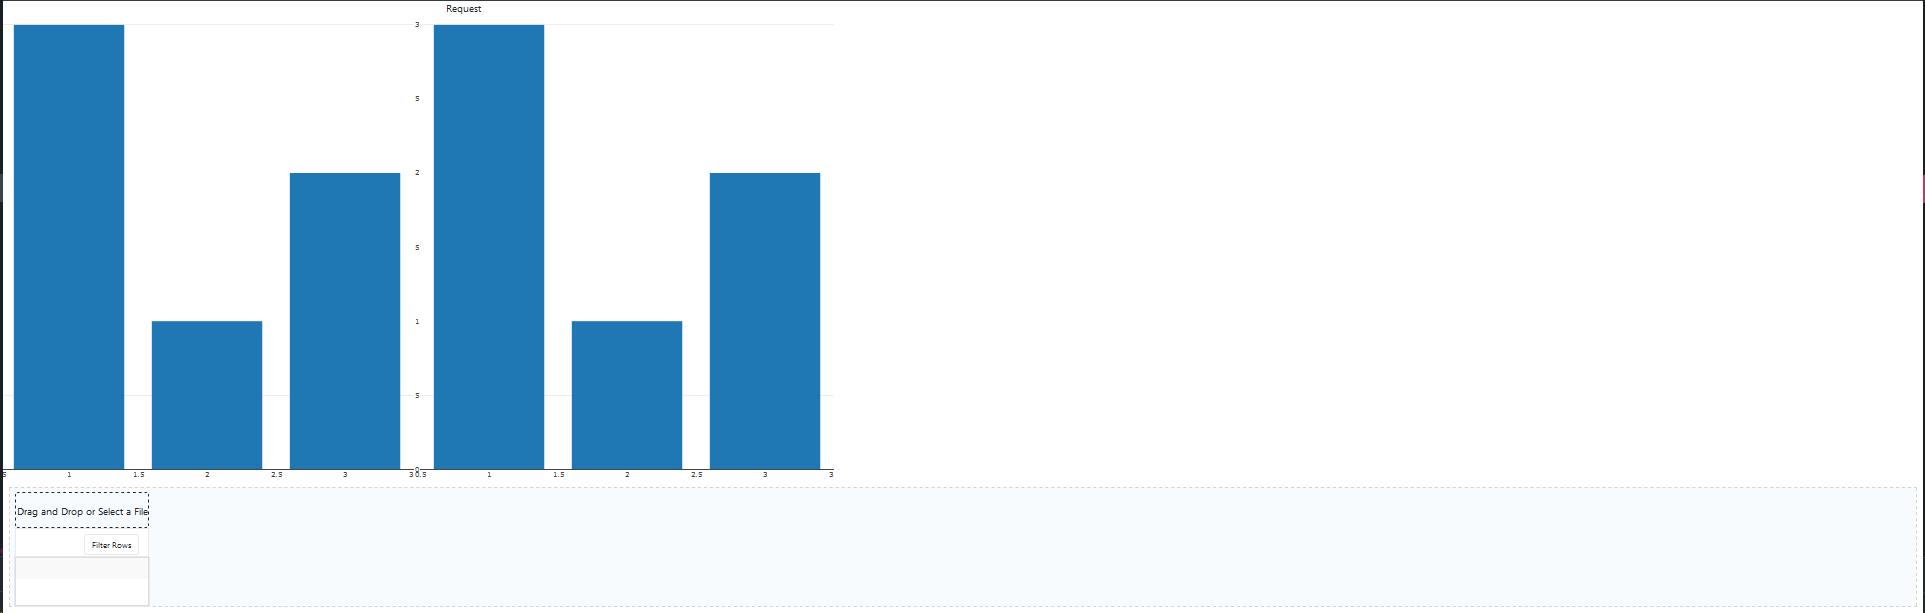
But what I got:
+++++++++++++++++++++++
+         +  figure2  +
+         +           +
+ figure1 +  figure3  +
+++++++++++++++++++++++
The question are here:
- Generally, How to manage parameters to change the layout?
- using width to mange the width but how to manage the height (in this case I want the figure1’s height doubles that of figure2 or figure3)?