There seems to be a strange bug in using subplot() in plotly with R
In some cases the interactive legend only affects one of the sub plots. Either hiding all data and showing the 1 group in only one plot instead of all, or only hiding one group from one plot, instead from all plots
I’ve been puzzling all afternoon but can’t figure out what the cause is exactly
in my own code, it seems to be linked to the number of rows, which seemed to be a max of 200 before problems begin, but while trying to build a reproducible example it got even stranger.
This works fine with basic iris data set.
library(plotly)
df <- iris
p1 <- df%>%
group_by(Species)%>%
plot_ly(x=~Sepal.Length, color= ~Species, legendgroup=~Species)%>%
add_markers(y= ~Sepal.Width)
p2 <- df%>%
group_by(Species)%>%
plot_ly(x=~Sepal.Length, color= ~Species, legendgroup=~Species)%>%
add_markers(y= ~Sepal.Width, showlegend=F)
subplot(p1,p2)
and we can hide all sets but one by double clicking the 1 set
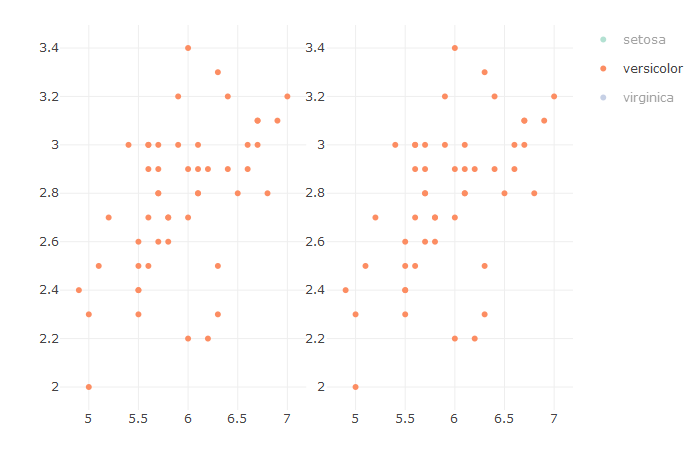
Doubling the data set gives the bug though, and I can’t figure out what the bug is exactly, just that it’s there
df <- rbindlist(list(iris, iris))
followed by the plot code again …
Now this I get this when double clicking
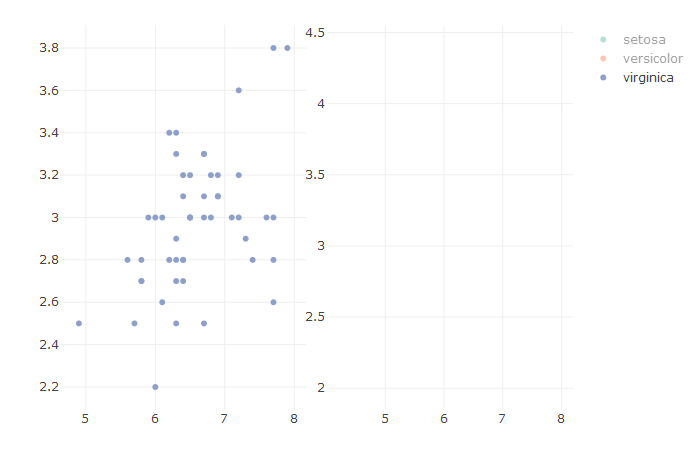
Also it is now impossible to get the plot back to normal start display.
I also tried to add unique valued rows, but no effect, the bug remain. How to fix this?
Mark