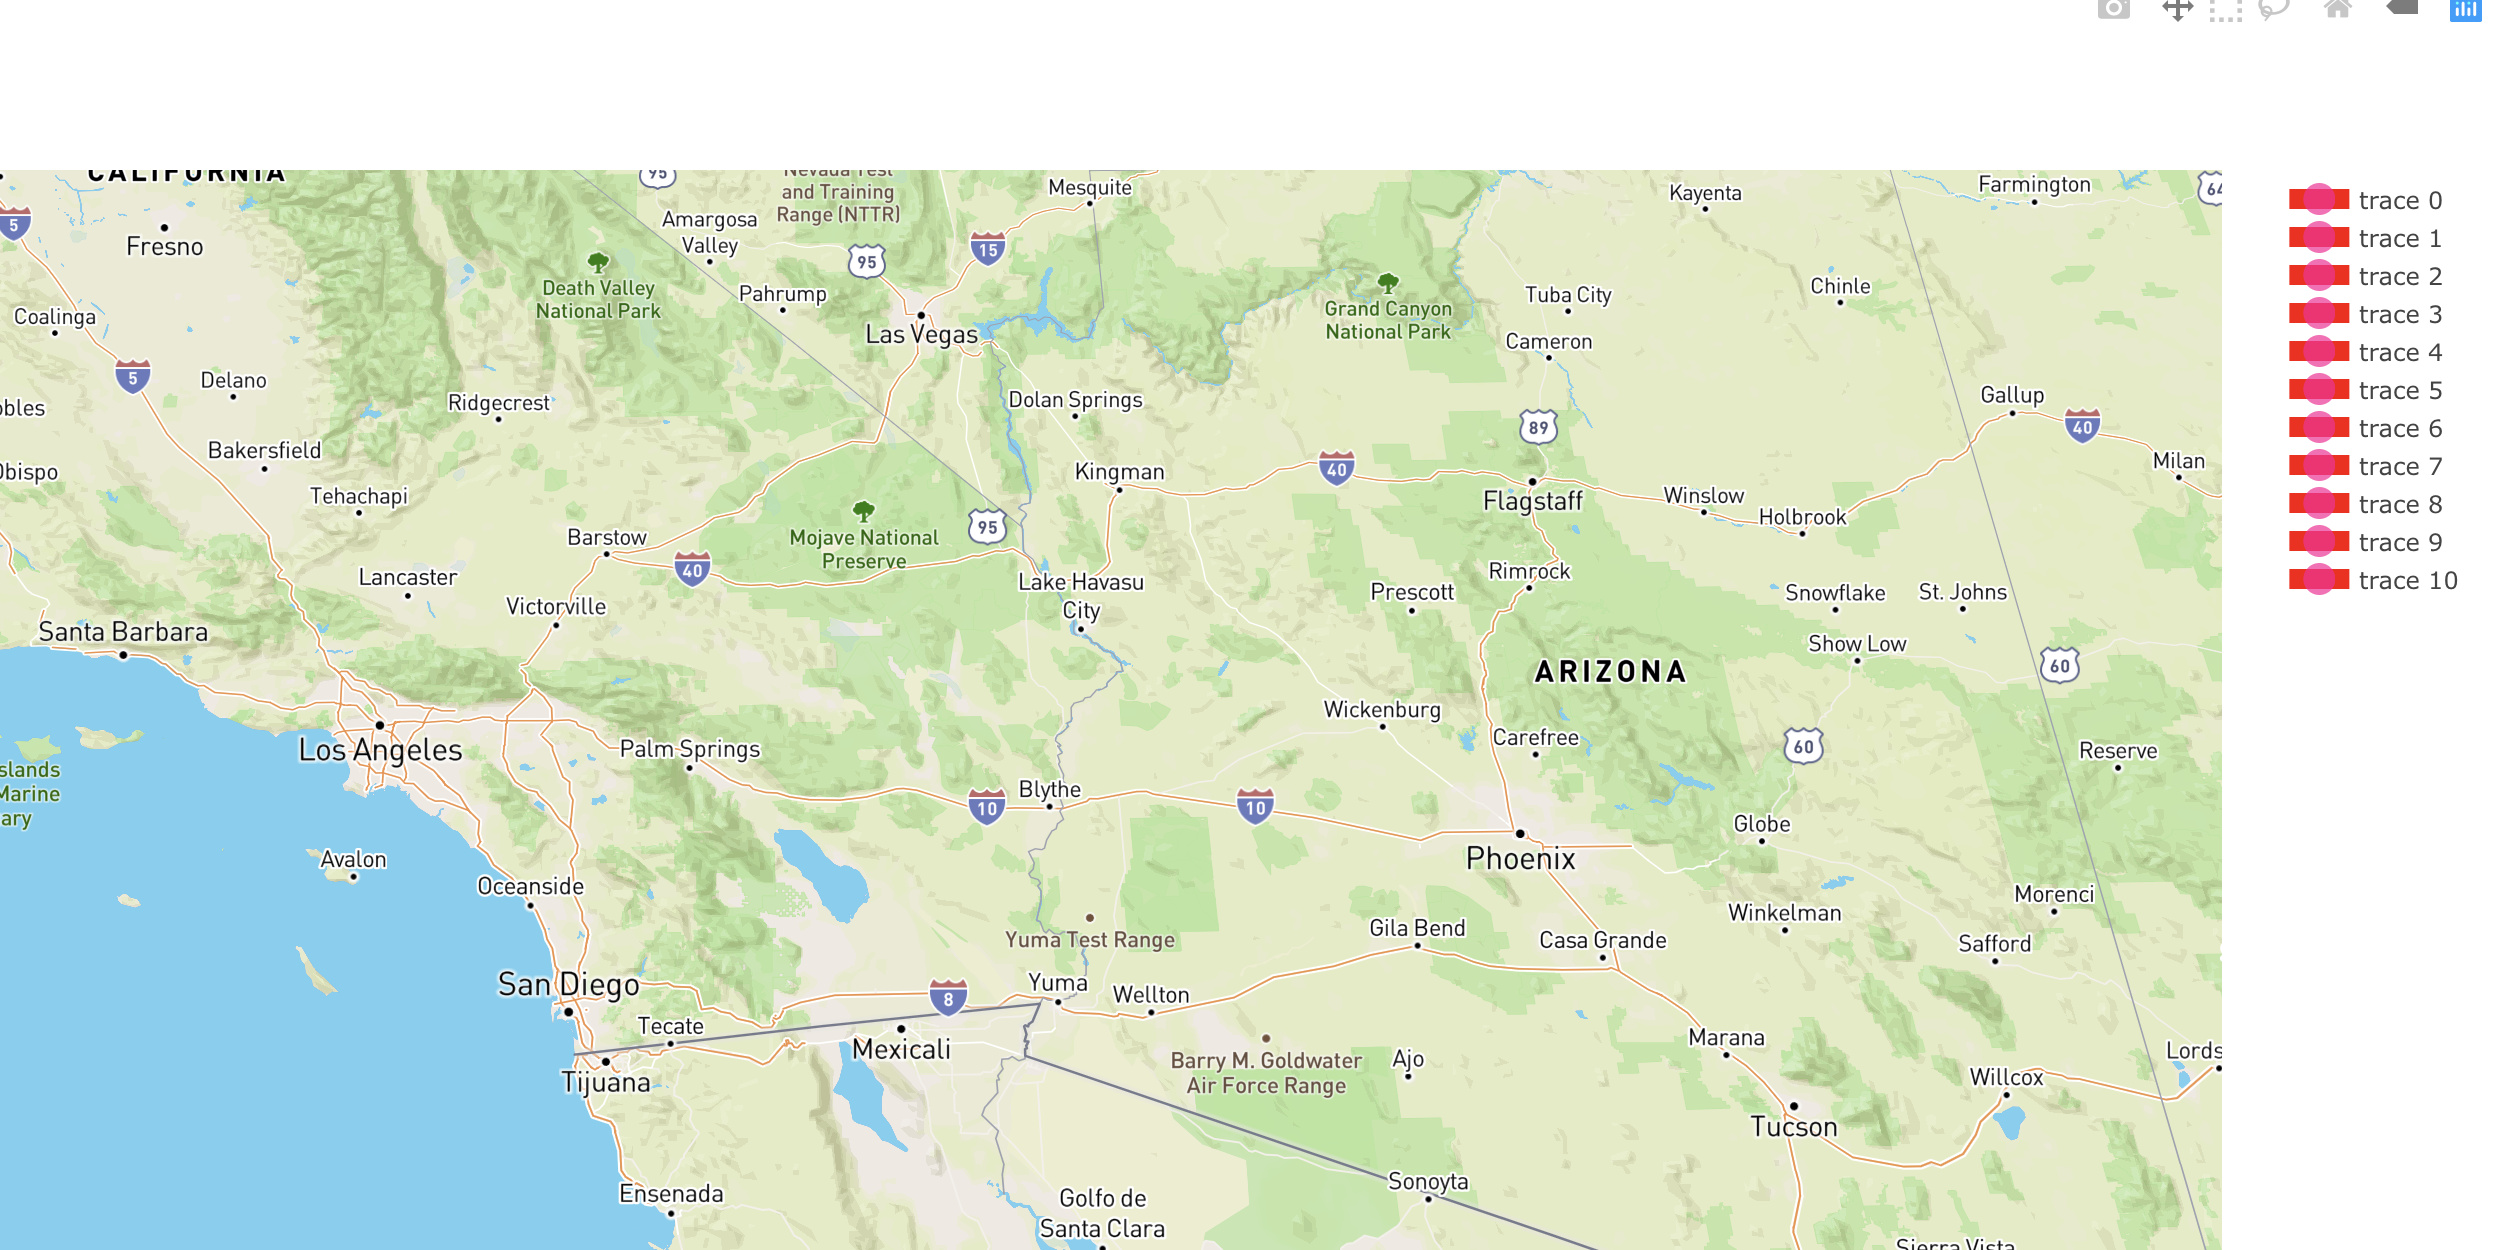
Hello, I am working on a map that will show the facilities in various locations and connected with lines. I deployed two data traces, one is for the locations and another one for connections. Locations shown as it supposes to be but the lines are not shown. The legends are shown, please take a look of the codes and the screenshot. Any comments and suggestions are greatly appreciated:
@app.callback(
Output(“map-graph2”, “figure”),
[Input(“day-range2”, “value”), Input(“map-graph2”, ‘hoverData’)])
def update_graph(hours, busname):
starttime = datetime.datetime.fromtimestamp(hours[0])
print("satrt time before rounding ", starttime)
starttime = rounder(starttime)
print("start time ", starttime)

dstart = df.loc[df.datetime == str(starttime)]
print(dstart.head())
close_threshod = dstart[dstart['Flow/ContRating'] >=0.5]
print(close_threshod.head())

dfbus['text'] = dfbus['Bus Name']

trace_0 = [go.Scattermapbox(lat=dfbus["lat"], lon=dfbus["lng"], mode='markers', hoverinfo="text",
                           showlegend=False,
                           marker=go.scattermapbox.Marker(
                               size=20,
                               color='rgb(255,0,150)',
                               opacity=0.7
                           ), text=dfbus.text)]

dstart['text'] = "Line: " + dstart['Line'] + "<br> " + "From " + dstart['From Bus'] + " To " + dstart[
    'To Bus'] + "<br> " + dstart['datetime']
print("size of close ", close_threshod.shape)
trace_1 = []
print(close_threshod.shape)
for i in range(close_threshod.shape[0]):
    trace_1.append(
        go.Scattermapbox(hoverinfo='text',
                         lat=[close_threshod['From lat'][i:i + 1], close_threshod['To lat'][i:i + 1]],
                         lon=[close_threshod['From lng'][i:i+1], close_threshod['To lng'][i:i+1]],

                         mode= "lines+markers",
                         showlegend=True,
                         line=go.scattermapbox.Line(width=10, color='red'),
                         marker=go.scattermapbox.Marker(
                             size=20,
                             color='rgb(255,0,150)',
                             opacity=0.7
                         ),
                         ),
    )

layout1 = go.Layout(hovermode='closest', height=640,
                    geo=dict(projection=dict(type="equirectangular"), ),
                    mapbox={'accesstoken': mapbox_access_token, 'bearing': 1, 'center': {'lat': 34, 'lon': -116},
                            'pitch': 20, 'zoom': 6, "style":'outdoors'})

return {"data": trace_1+trace_0, "layout": layout1}
if name == ‘main’:
app.run_server(debug=True)