I need to create a graph from data with python.
I took my inspiration from various website and I’ve made this script :
import plotly.express as px
import plotly.graph_objs as go
import statsmodels.api as sm
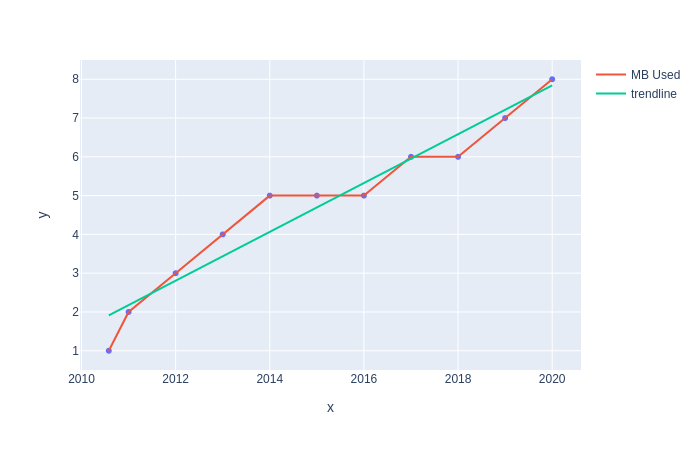
value = [1, 2, 3, 4, 5, 5, 5, 6, 6, 7, 8]
date = [ 2010, 2011, 2012, 2013, 2014, 2015, 2016, 2017, 2018, 2019, 2020]
fig = px.scatter(x=date, y=value )
fig.add_trace(go.Scatter(x=date, y=value, mode='lines',name='MB Used' ))
trend = sm.OLS(value,sm.add_constant(date)).fit().fittedvalues
fig.add_traces(go.Scatter(x=date, y=trend,mode = 'lines', name='trendline'))
fig
This script allow to generate this graph :
For the x axe, I would like to display the value like that 2020-01-01-06:00 but when I change my list like that :
date = [ 2020-01-01-06:00, 2020-01-01-12:00, 2020-01-01-18:00, 2020-01-02-06:00, 2020-01-02-12:00, 2020-01-02-18:00, 2020-01-03-06:00, 2020-01-03-12:00, 2020-01-03-18:00, 2020-01-04-06:00, 2020-01-04-12:00 ]
The error is :
File "<ipython-input-13-4958920545c3>", line 6
    date = [ 2020-01-01-06:00, 2020-01-01-12:00, 2020-01-01-18:00, 2020-01-02-06:00, 2020-01-02-12:00, 2020-01-02-18:00, 2020-01-03-06:00, 2020-01-03-12:00, 2020-01-03-18:00, 2020-01-04-06:00, 2020-01-04-12:00 ]
                   ^
SyntaxError: invalid token
If I try that :
date = [ '2020-01-01-06:00', '2020-01-01-12:00', '2020-01-01-18:00', '2020-01-02-06:00', '2020-01-02-12:00', '2020-01-02-18:00', '2020-01-03-06:00', '2020-01-03-12:00', '2020-01-03-18:00', '2020-01-04-06:00', '2020-01-04-12:00' ]
The error is :
---------------------------------------------------------------------------
TypeError                                 Traceback (most recent call last)
<ipython-input-15-e06e438ca2eb> in <module>
     10 fig.add_trace(go.Scatter(x=date, y=value, mode='lines',name='MB Used' ))
     11
---> 12 trend = sm.OLS(value,sm.add_constant(date)).fit().fittedvalues
     13
     14 fig.add_traces(go.Scatter(x=date, y=trend,mode = 'lines', name='trendline'))

~/.local/lib/python3.6/site-packages/statsmodels/tools/tools.py in add_constant(data, prepend, has_constant)
    303         raise ValueError('Only implementd 2-dimensional arrays')
    304
--> 305     is_nonzero_const = np.ptp(x, axis=0) == 0
    306     is_nonzero_const &= np.all(x != 0.0, axis=0)
    307     if is_nonzero_const.any():

<__array_function__ internals> in ptp(*args, **kwargs)

~/.local/lib/python3.6/site-packages/numpy/core/fromnumeric.py in ptp(a, axis, out, keepdims)
   2541         else:
   2542             return ptp(axis=axis, out=out, **kwargs)
-> 2543     return _methods._ptp(a, axis=axis, out=out, **kwargs)
   2544
   2545

~/.local/lib/python3.6/site-packages/numpy/core/_methods.py in _ptp(a, axis, out, keepdims)
    228 def _ptp(a, axis=None, out=None, keepdims=False):
    229     return um.subtract(
--> 230         umr_maximum(a, axis, None, out, keepdims),
    231         umr_minimum(a, axis, None, None, keepdims),
    232         out

TypeError: cannot perform reduce with flexible type
Please, could you show me how to change that ?
