Combination of go.Scatter3d and go.Mesh3d

I used mesh3d to fill out the space between to Bezier curves, but I get something I don’t want

To built Bezier’s curves I use GitHub - torresjrjr/Bezier.py: ➰ Create Bezier curves in Python [Mirror]

import numpy as np
import plotly.graph_objects as go
from Bezier import Bezier
t_points = np.arange(0, 1, 0.01) 
points1 = np.array([[-5, 0], [0, 6], [8, 5], [8, 5]]) 
curve1 = Bezier.Curve(t_points, points1)
x1=[x[0] for x in curve1]
y1=[1 for x in curve1]
z1=[x[1] for x in curve1]
points2 = np.array([[-5, 0], [0, 6], [8, 5], [8, 5]]) 
curve2 = Bezier.Curve(t_points, points2)
x2=[x[0] for x in curve2]
y2=[10 for x in curve2]
z2=[x[1] for x in curve2]
dat=[go.Scatter3d(x=x1,y=y1,z=z1,
                mode ='lines',
                name='c1',
                line=dict(color='red',width=3)),
     go.Scatter3d(x=x2,y=y2,z=z2,
                mode ='lines',
                name='c2',
                line=dict(color='red',width=3)),
     go.Mesh3d(x=x1+x2,y=y1+y2,z=z1+z2, 
                     delaunayaxis='x',
                     name='sup',
                     opacity=0.5,
                     color ='green'
                    )]

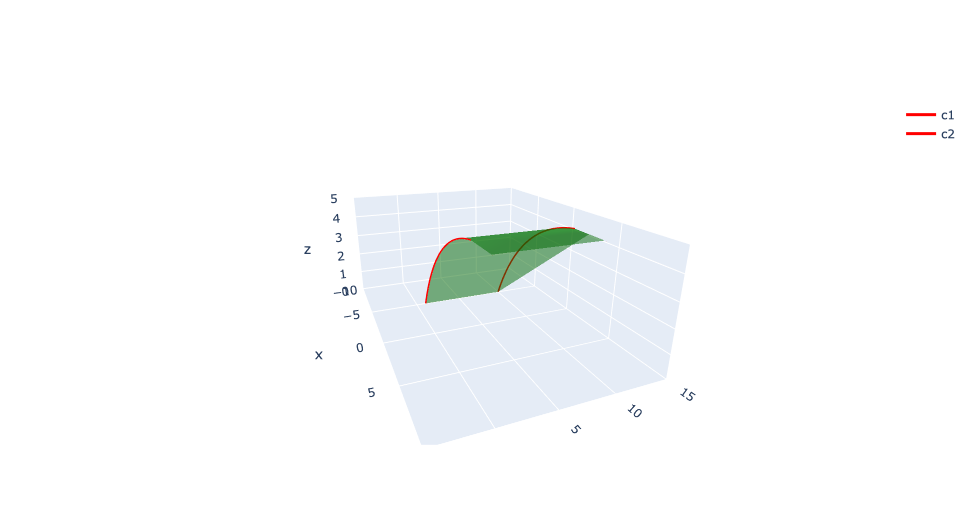
I don’t want the following par to appear in the figure

How can I remove it?

Thanks

Hi @bullejos, what exactly are you referring to? Thinking about it, I would try if changing to delaunayaxis='y' and alphahull=-1 results to what you expect.

Hi @aimep

To be more concrete, the following code:

t_points = np.arange(0, 1, 0.01) 
points1 = np.array([[-5, 0], [0, 6], [8, 5], [8, 5]]) 
curve1 = Bezier.Curve(t_points, points1)
x1=[x[0] for x in curve1]
y1=[1 for x in curve1]
z1=[x[1] for x in curve1]

points2 = np.array([[-5, 0], [0, 6], [8, 5], [8, 5]]) 
curve2 = Bezier.Curve(t_points, points2)
x2=[x[0] for x in curve2]
y2=[10 for x in curve2]
z2=[x[1] for x in curve2]

points3 = np.array([[-5, -3], [0, 3], [8, 2], [8, 2]]) 
curve3 = Bezier.Curve(t_points, points3)
x3=[x[0] for x in curve3]
y3=[1 for x in curve3]
z3=[x[1] for x in curve3]

points4 = np.array([[-5, -3], [0, 3], [8, 2], [8, 2]]) 
curve4 = Bezier.Curve(t_points, points4)
x4=[x[0] for x in curve4]
y4=[10 for x in curve4]
z4=[x[1] for x in curve4]

dat=[go.Scatter3d(x=x1,y=y1,z=z1,
                mode ='lines',
                name='c1',
                line=dict(color='red',width=3)),
     go.Scatter3d(x=x2,y=y2,z=z2,
                mode ='lines',
                name='c2',
                line=dict(color='red',width=3)),
     go.Scatter3d(x=x3,y=y3,z=z3,
                mode ='lines',
                name='c3',
                line=dict(color='red',width=3)),
     go.Scatter3d(x=x4,y=y4,z=z4,
                mode ='lines',
                name='c4',
                line=dict(color='red',width=3)),
     go.Mesh3d(x=x1+x2+x3+x4,
               y=y1+y2+y3+y4,
               z=z1+z2+z3+z4, 
                delaunayaxis='x',
                alphahull = 0,
                     name='sup',
                     opacity=0.5,
                     color ='green'
                    )]

gives

but I don’t want anything below c4 and c3.

If I set alphahull = -1 I get

and alphahull = 1 gives

But I just want to fill the space between the curves.

Changing delaunayaxis=‘y’ don’t work either

@bullejos the initial example had only two lines. Did you try to apply my suggestions to your first example?

It seems, that you are looking for the convex hull defined by your (4) lines which is not trivial. I actually never found a robust way to calculate the convex hull for rather complex geometries.

alphashape=0 calculates the concave hull.

Maybe instead of creating a mesh3d for all lines you could calculate them pairwise and add the mesh3d traces into the final figure.

@empet has a lot of posts related to triangulation and 3D structures, it’s worth taking a look on those:

https://community.plotly.com/search?q=%40empet%20triangulation

Hello @bullejos,
From your post it’s not quite clear what you want to plot. I assumed that you are interested in the surfaces that interpolate linearly the corresponding points on two curves. If this is a case here is the code that performs that task.
I defined a Bezier curve using the de Casteljau algorithm, presented herehttps://github.com/empet/Geometric-Modeling/blob/master/FP-Bezier-Bspline.ipynb (the notebook containing this topic is written eight years ago, in Python 2. Therefore some functions may no longer work, but deCasteljau and Bezier are still valid).

import plotly.graph_objects as go
import numpy as np

class InvalidInputError(Exception):
    pass
def deCasteljau(ctrlp,t): 
    N=len(ctrlp) 
    if(N<2):
        raise InvalidInputError("The  control polygon must have at least two points")
    a=np.copy(ctrlp) #copy of the list of control points and its conversion to a numpy.array 
    for r in range(1,N): 
        a[:N-r,:]=(1-t)*a[:N-r,:]+t*a[1:N-r+1,:]# convex combinations in step r                               
    return list(a[0])
def Bezier(ctrlp, nr=101):# compute nr points on the Bezier curve of control points in the list  ctrlp
    t=np.linspace(0, 1, nr)
    return [deCasteljau(ctrlp, s) for s in t]      

def segm_coords(a, b):
    if len(a)!=len(b):
        raise ValueError("a, and b must be of array type and the same len")
    v= np.linspace(0,1, 11)
    #returns all convex combinations of corresponding elements in a and b
    return [(1-v)*a[k]+v*b[k] for k in range(len(a))]

points1 = [[-5.0, 0], [0.0, 6], [8.0, 5], [8.0, 5]]
curve1 = Bezier(points1)
x1=[x[0] for x in curve1]
y1=[1 for x in curve1]
z1=[x[1] for x in curve1]

x2=[x[0] for x in curve1]
y2=[10 for x in curve1]
z2=[x[1] for x in curve1]

points3 = [[-5.0, -3], [0.0, 3], [8.0, 2], [8.0, 2]] 
curve3 = Bezier(points3)
x3=[x[0] for x in curve3]
y3=[1 for x in curve3]
z3=[x[1] for x in curve3]

x4=[x[0] for x in curve3]
y4=[10 for x in curve3]
z4=[x[1] for x in curve3]

figs=go.Figure([go.Surface(x=segm_coords(x1,x2), 
                           y=segm_coords(y1,y2), 
                           z=segm_coords(z1,z2), 
                           coloraxis="coloraxis"), 
                go.Surface(x=segm_coords(x1,x3), 
                           y=segm_coords(y1,y3), 
                           z=segm_coords(z1,z3), 
                           coloraxis="coloraxis"),
                 go.Surface(x=segm_coords(x2,x4), 
                           y=segm_coords(y2,y4), 
                           z=segm_coords(z2,z4), coloraxis="coloraxis")],
                go.Layout(width=400, height=400, font_size=11,
                          scene_camera_eye=dict(x=1.6, y=1.6, z=1), 
                         coloraxis=dict(colorscale=[[0, "green"], [1, "green"]],
                                       showscale=False)))
figs.show()

surf-bezier
Note that I didn’t plot the curves, because I assume you have drawn them just to understand how the surface is generated.

1 Like

Great @empet that is just what I wanted, thank you very much.

1 Like